
If you’re reading this article, you probably already know what image alt text is, and how to write it for simple images. But it gets a bit trickier when it comes to things like charts and graphs. There’s a maximum number of characters you can include, and you can only use simple text, not lists or tables. Fortunately, there’s a relatively simple solution.
Complex Images
On our Accessibility 101 page we have an illustration which shows different types of disabilities and examples of them:
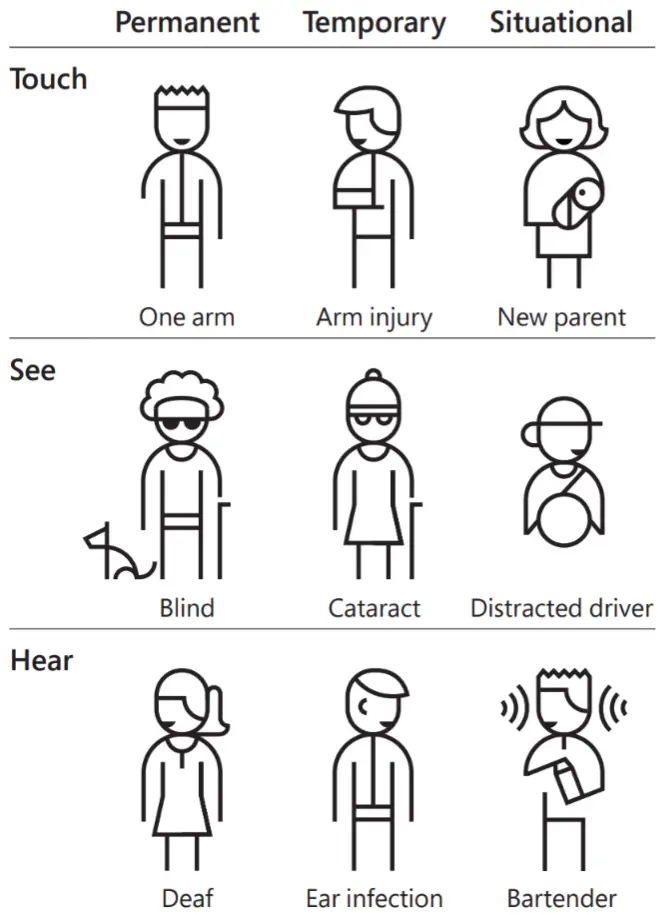
Obviously, there is no way to adequately provide an alternative text description of this image in one short sentence. So the solution is to:
- Add brief alt text which informs the screen reader user what the basic purpose of the image is, and that a more detailed description is available after it
- Provide alternative content in the page and hide that from sighted users with CSS
Here’s an abbreviated version of the code we use for that illustration:
<img src="my-img.png" alt="Various types of disabilities. Detailed description below.">
<table class="sr-only">
  ...
</table>
CSS to hide content from sighted users:
.sr-only {
  position: absolute;
  width: 1px;
  height: 1px;
  padding: 0;
  overflow: hidden;
  clip: rect(0, 0, 0, 0);
  white-space: nowrap;
  -webkit-clip-path: inset(50%);
  clip-path: inset(50%);
  border: 0;
}
Charts, Graphs, and Manuals
This topic came up on an accessibility forum I’m involved in recently when a poster asked how to address things such as illustrated instruction manuals. He didn’t post a specific example, so I grabbed an image from one of the infamous Ikea furniture assembly manuals, and figured I’d give it a go. Here’s the image:
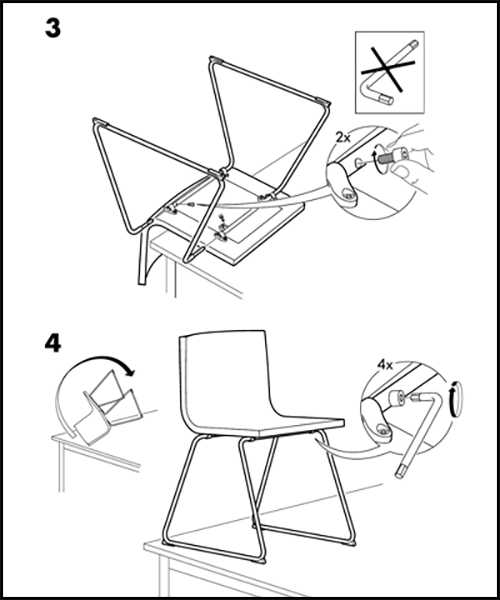
It seems clear that the best way to convey steps in a process is through the use of an ordered list. Since each illustration involves more than one step, we’ve broken the steps out to make them easier to understand. Here’s the code:
<div class="sr-only">
  <h3>Chair Assembly Instructions</h3>
  <ol>
    <li>Place the chair body upside down on a table, with the seat flat on the table, and the back of the chair over the edge of it.</li>
    <li>Insert the seat legs through the square metal bars on the bottom of the seat.</li>
    <li>Insert the two Allen head screws through the holes in the bars and into the legs. Do not use an Allen wrench.</li>
    <li>Hand tighten the screws and then turn the chair right side up on the table.</li>
    <li>Tighten the screws with the provided Allen wrench.</li>
  </ol>
</div>
Granted, this method won’t work for every image, but it should cover the vast majority of them. Even alternatives to interactive charts and graphs which are dynamically updated can be provided for screen readers users by adding an aria-live attribute to our “sr-only” content region. Perhaps we’ll do an article on that some time.